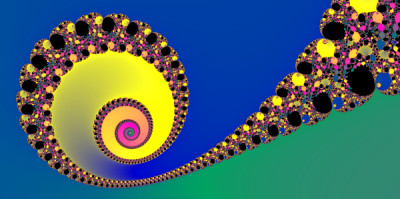

While this app should work on most phones and tablets, it is recommended to use a desktop or laptop computer to get the full experience.
Move your scroll wheel, pinch your touchscreen, or press the + button on the picture to zoom in and reveal more detail.
Use your mouse or finger to drag the picture around like a map.
Use the Jump To menu to choose a few sample places of interest in the Mandelbrot Set. The Coordinates section shows the Real/Imaginary coordinates at the centre of the picture, as well as the number of iterations needed for that point to diverge. If that point never diverges, it will show "n/a". The Axes checkbox will toggle the Real/Imaginary zero axes. This also toggles axes on the Julia set if it is selected (see below). To see the coordinates at a different point, move your mouse pointer around the picture area.
The Max Iterations slider lets you set the limit on how many times each point is iterated to find out if it diverges. This effectively lets you control the level of detail. Because of the computing power needed to calculate the fractal, higher values may slow down the drawing process. Slide it to the right to see more detail; slide it to the left to make it draw faster.
To see the Julia set for any point in the Mandelbrot fractal, select the Corresponding Julia set checkbox. This will show the Julia set for the coordinates in the center of the Mandelbrot picture. To see the Julia set for a different point, move your mouse pointer around the picture area, and watch how the Julia picture changes. This will have a greater effect on the Julia picture at wider zoom levels (zoomed out). To see more or less detail in the Julia set, move the Max iterations slider inside the Julia section.
To learn more about the Mandelbrot and Julia sets, explore the Mandelbrot Set tab above.The picture is drawn using a palette of 255 colours, plus black. You can use the '<' and '>' buttons to change to one of 14 different colour palettes. The palette "Classic VGA" is the default colour palette used in the IBM PC, and featured in many DOS programs in the 1990's.
The Animate button toggles Colour Cycling - rotating all 255 colours within the current palette, giving a crude form of animation. This effect was also used in many older DOS programs.
To lessen the rough steps between each colour ("banding"), select the Smooth checkbox. This uses a different algorithm to generate the colours which, while less mathematically accurate, gives smoother shading and a more aesthetically pleasing image.
Use the Poster button to make a high quality (4000x3000) image of your fractal at its current position. This can take quite some time to calculate - a few seconds to several minutes, depending on the complexity of the area and the speed of your computer. While it is calculating the fractal, four white bars will move down the sides of the picture, showing the progress of each CPU thread. Once it is done a popup message will appear inviting you to open or save your picture.
The Permalink button gives a link to your current position within the fractal so you can come back to it later or share it with friends. You can copy the text that appears in the dialog box to your clipboard, or just click the generated link, then use your browser to Bookmark it. The generated link includes the current position, zoom level, iteration limit, and colour information.
For more about the mathematics behind this app, explore the Mandelbrot Set and Fractals tabs above.